DIALux and Relux are the most commonly used software and applications for designing lighting systems in Europe. These systems use .ldt or .ies file formats that contain photometric data about light. Moreover, on their basis, a lighting simulation of a given space is created. What if, by means of these programs, UVC disinfection sources could be evaluated? It is now possible thanks to the use of GL measuring systems and GL Spectrosoft software.
With our professional systems, measuring light sources in the range between 200nm up to 1100 nm is fast and easy. For the UV light sources, we are able to measure Radiant Intensity Distribution which is the equivalent of Luminous Intensity Distribution in the visual range. Radiant Intensity Distribution measurement is a tool that helps to characterise the light source and to evaluate the performance of the radiation distribution from the lamp or other emitting source.
For absolute measurements in this extended spectral range, GL Spectis 5.0 with different optical probes is usually offered. Last year, we’ve introduced a new spectroradiometer, namely, GL Spectis 4.0. It is specified to be used with a goniometer system to test the UV light sources. This combination gives a chance to fully characterise the Radiant Intensity Distribution beyond the visual range.
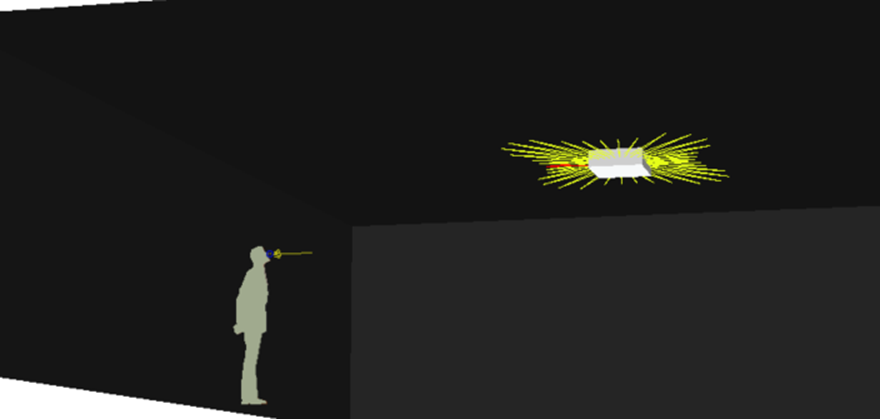
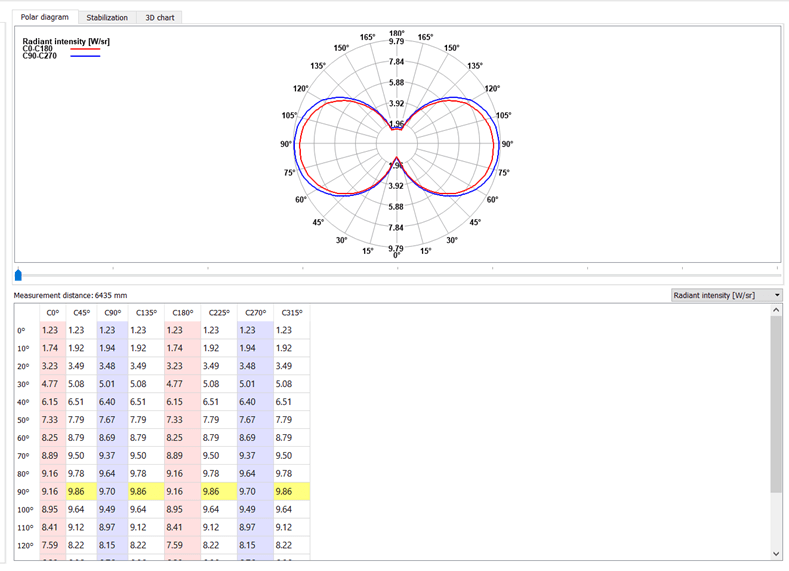
3D characterisation of the light source radiometric performance could be done in the same way as dealing with photometric performance. Instead of luminous intensity expressed in candelas (cd), radiant intensity distribution expressed in Watts per steradian (W/sr) has to be measured. Goniometric measurements combined with appropriate radiometric/spectroradiometric sensors allow to collect necessary reading points for measured luminaire (spatial distribution). (Fig.1)
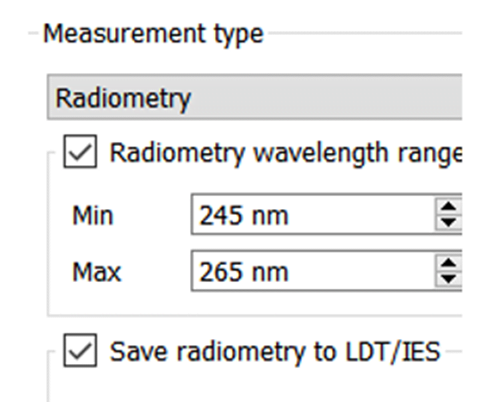
Radiometric data values measured for particular spectral range could be saved in txt. format equivalent to .ltd or .ies. (Fig. 2)
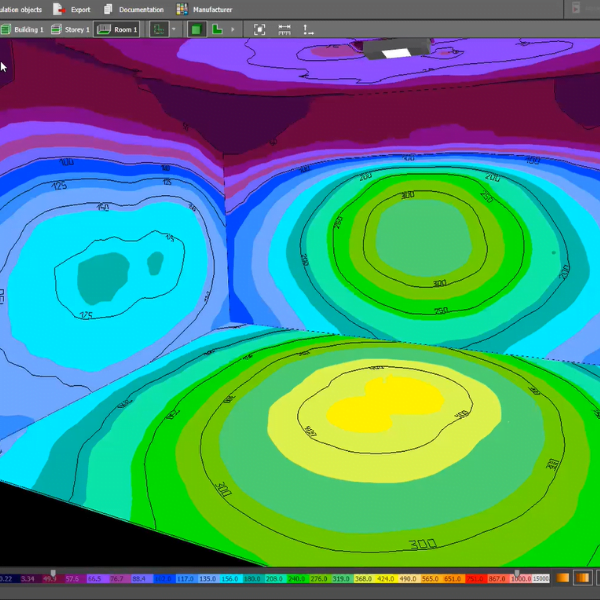
With photometric files containing radiometric values, lighting design tools could be applied for designing all the UV application areas based on accessible software capable of reading .ltd or .ies file formats. Calculated irradiance values would be expressed in lux while they refer to radiometric values in Watt per square meter.