
GL SPECTROSOFT M
The brains behind our systems

Upgradable software for quick & reliable spectral analysis
GL SPECTROSOFT M is a modular, PC-based analytical software designed for laboratory applications, field work, production quality control and for general light assessment purposes. With a range of powerful add ons, GL SPECTROSOFT M adds power, speed and efficiency to your GL SPECTROMETER. Whether analyzing field measurements, comparing lighting scenarios, or supporting production quality control, this versatile software platform provides quick access to all important information.
Powerful light assessment software
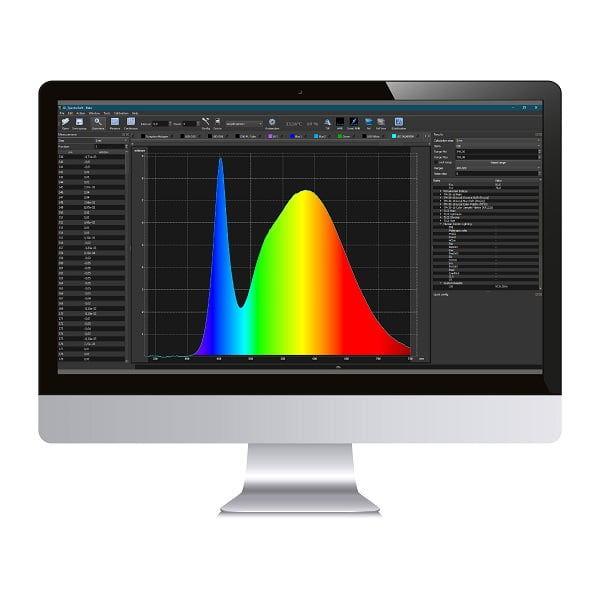
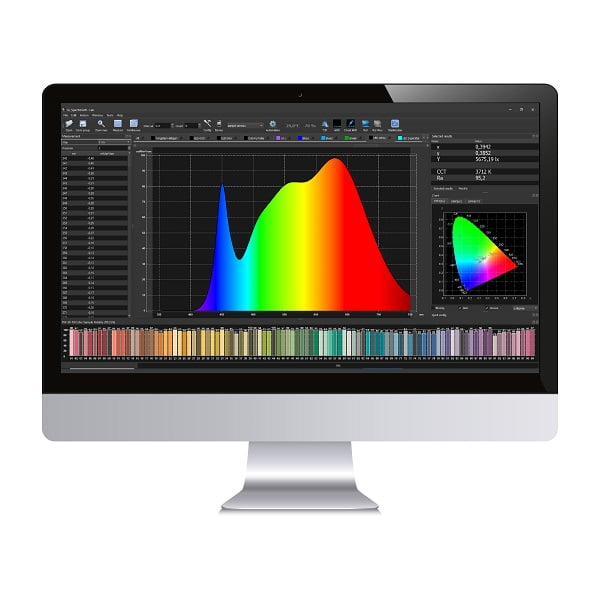
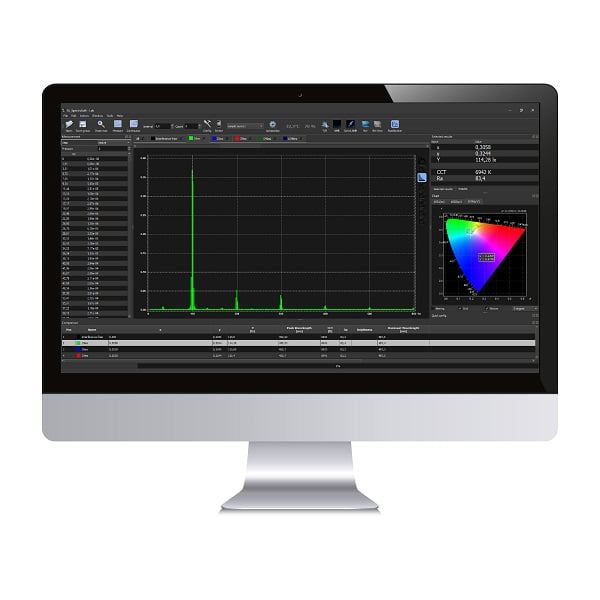
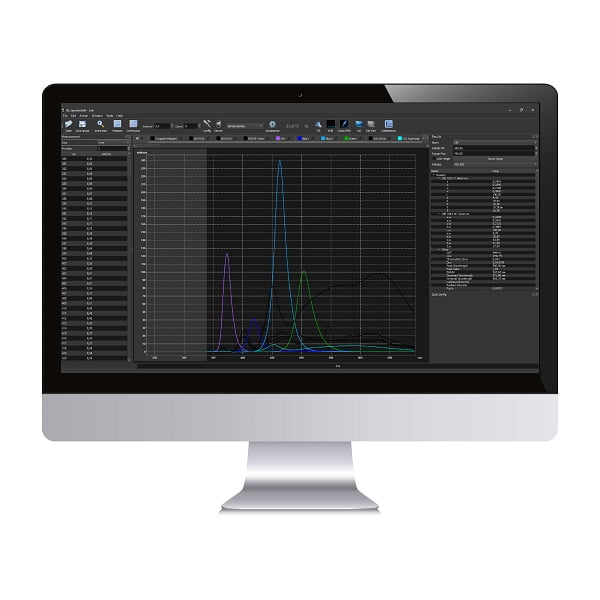
As purpose built light measurement software written for GL Optic’s measurement instrument, GL SPECTROSOFT M is “the key” for all the advanced features of the spectrometers. It turns raw data from devices into powerful information. The software provides data in well presented and customizable windows (tables) and also in an easy to interpret graphical charts. Advanced features include configurable pass/fail criteria and structured reporting formats to simplify presentation and sharing of results. Spectrosoft Connect is included with all systems, other versions optional.
Every metric
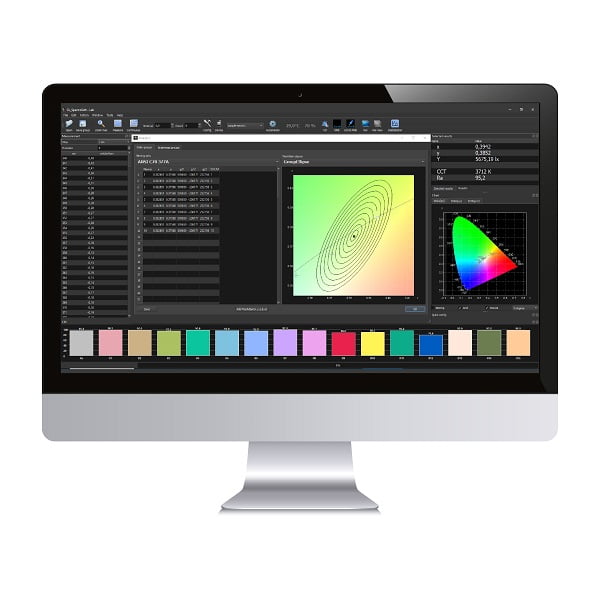
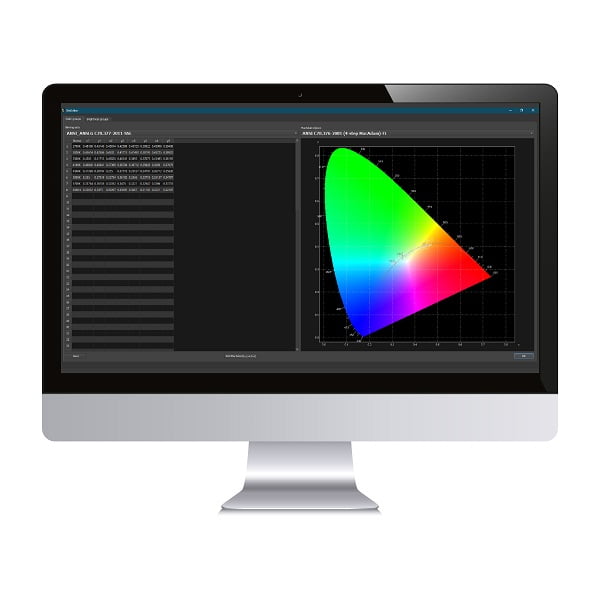
Calculate, evaluate, present or report such parameters as: CCT, chromaticity error, peak wavelength, dominant wavelength, CRI, color coordinate values according to CIE standards, ISO, metamerism index, PAR, PPF, PPFD, photobiological safety, binning, MacAdam ellipses and much more.
Expanded capabilities
With an extensive range of analysis, automation and reporting tools, the days of exporting data to excel to crunch data are over. The tools go beyond “standard” spectral analysis with options like color mixing, pass/fail, relative comparisons and more. It even integrates with CAD for simplified field audits.
Stay up-to-date
GL SPECTROSOFT M light measurement software already offers best in class analysis and automation capabilities, but that doesn’t stop us from implementing new features and tools regularly. We adapt to the changing industry and deliver the metrics and tools lighting professionals need.
GL SPECTROSOFT M Usage
Multi-purpose
GL SPECTROSOFT M can calculate, evaluate, present or report such parameters as: CCT, chromaticity error, peak wavelength, dominant wavelength, CRI, color coordinate values according to CIE standards, ISO, Metamerism Index, PAR, PPF, PPFD, photobiological safety, binning, MacAdam ellipses and much more…
Experiments
This light measurement software gives a user the opportunity to experiment using collected data: to test them (e.g. PAS/FAIL), to analyze them according to international standards (CIE, ISO etc.), compare them with other data (reference window) and make calculations using different parameters (e.g. counting luminous intensity values).
One platform, all devices
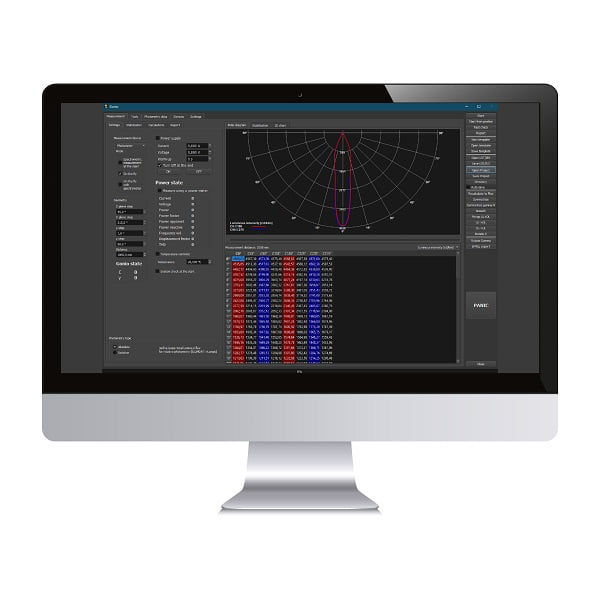
GL SPECTROSOFT M works as a plug-and-play tool for all our spectrometers, integrating sphere systems or goniometer systems. Our solutions are designed to scale with your business and eliminate unnecessary learning curves that come with changing software.
GL SPECTROSOFT M Features
OS behind our spectrometers, optical spheres and probes
GL SPECTROSOFT always uses the right calibration file for the instruments (the software recognises a special coded system held in the measurement adapters) so the user is always sure that the program is showing absolute values (e.g. The measurement made with the set GL SPECTIS 1.0 and GL OPTI SPHERE, shows values of luminous flux in lumens).
Flexible
Our powerful light measurement software offers extensive configurability and can be adapted to client needs (e.g. you can choose some parameters always available in quick window “selected results”, you can build your own template of reports or create your own layout according to the customer’s needs).
Data storage
All measurement data is stored and available at any time for comparison with new measurements values. Save files locally in our file format or export to excel or word for distribution to your team or clients.
Constantly improving
The market and standards requirements for LED’s are always changing, so why shouldn’t the tools you use? We maintain a close relationship with the market and standards committees and continue to invest heavily in our development so we can deliver complete light measurement solutions to our customers.
GL SPECTROSOFT M Calculations
Spectral and color
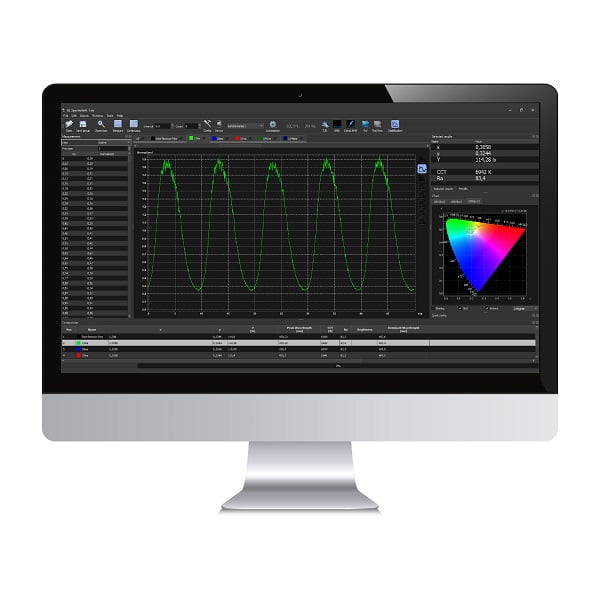
And optical flicker metrics like:
Plus many more! Contact us for a full list of calculations.
Software levels
GL SPECTROSOFT M is a complete software suite to analyze, interpret and present your results. Choose the license level suitable for your needs.
Connect
Free of charge * license, supporting entry-level applications.
Basic
Entry-level light analysis and reporting for users with basic light evaluation needs.
Pro
Powerful light analysis for professional lighting evaluation and advanced reporting capabilities.
Lab
Laboratory quality tools for advanced spectral analysis, comparisons, testing and customized measurement setups.
Related products
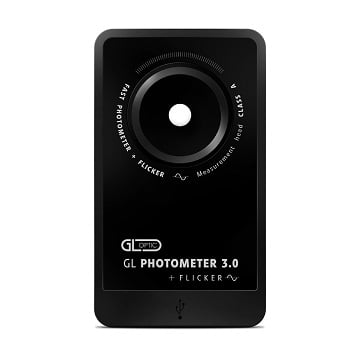
GL PHOTOMETER 3.0 + FLICKER
GL PHOTOMETER 3.0 + Flicker is a high sensitivity and high sampling rate photometer capable of extensive measurements of light flicker in addition to regular photometry.
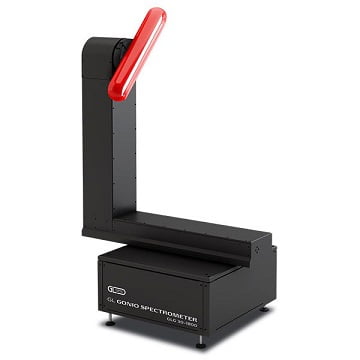
GL GONIO SPECTROMETER GLG 30-1800
Measure radiant power, luminous flux, color temperature, color coordinates and color rendering index (CRI) of LEDs.
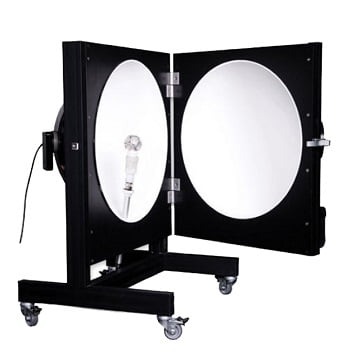
GL OPTI SPHERE 500
Complete integrating sphere solution for luminous flux and radiant power measurement of LED retrofit lamps.